Bank Loan Analysis Dashboard
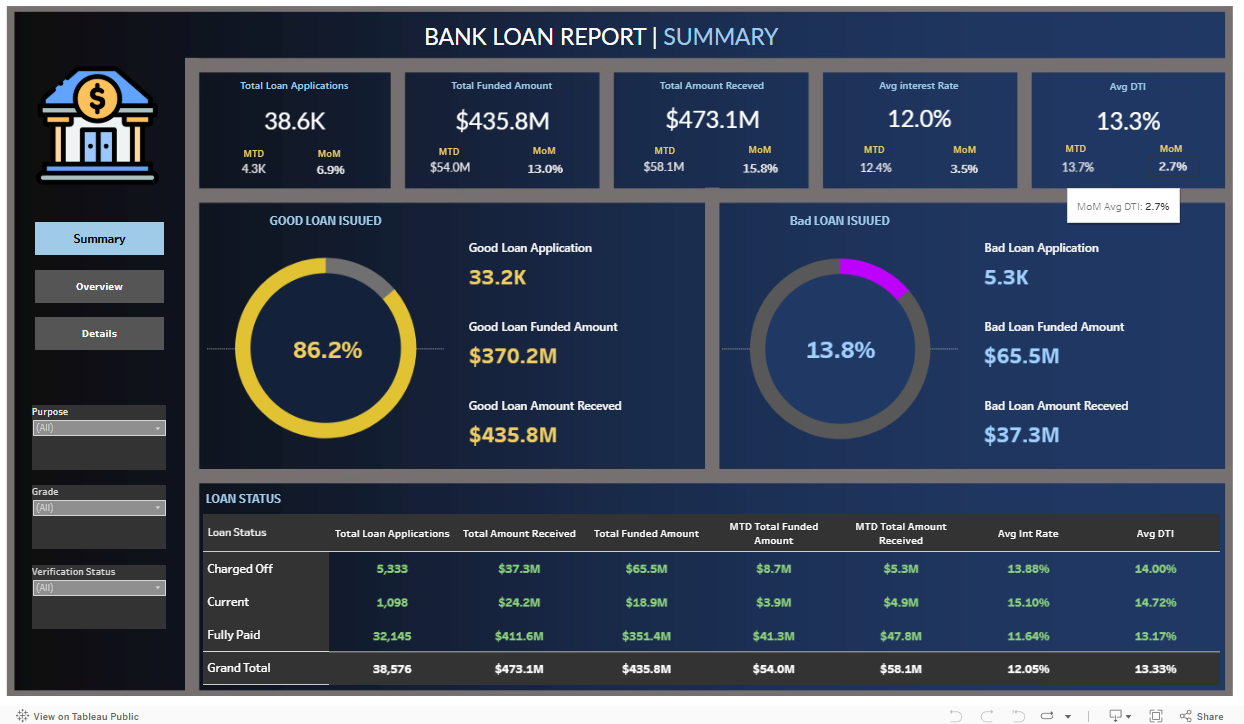
This project transforms raw bank loan data into actionable visual insights. Spanning 38,576 clean records, it highlights trends in loan applications, funding amounts, repayments, interest rates, and risk metrics.
This project transforms raw bank loan data into actionable visual insights. Spanning 38,576 clean records, it highlights trends in loan applications, funding amounts, repayments, interest rates, and risk metrics.
The objective of this analysis is to quantify and evaluate key performance indicators—such as loan application volume, funded amounts, repayments, interest rate fluctuations, and debt-to-income (DTI) ratios—in order to enhance risk management and inform strategic lending decisions.
The dataset was imported into MSSQL Server from a raw CSV file with 38,577 rows and underwent extensive cleaning and transformation. Data type corrections, missing value imputations, and error fixes were meticulously performed before visualizing the results entirely in Tableau.
Bank Loan Analysis Dashboard: This project combines rigorous SQL data validation with advanced Tableau visualization techniques to deliver a detailed analysis of a financial institution's lending operations.
Financial_Loan_Data.csv, approximately 15 MB with 38,577 rows and 21 fields.BankLoanDB) using the "Import Flat File" wizard./Data, /SQL_Scripts, and /Dashboard_Exports.total_payment to INT).emp_title field from varchar(50) to varchar(100) to accommodate longer values.emp_title and addressed blank next_payment_date values for fully paid loans.Robust SQL queries were executed to validate data quality and extract key performance metrics.
SELECT COUNT(id) AS Total_Loan_Applications
FROM [BankLoanDB]..bank_loan_data;SELECT COUNT(id) AS MTD_Total_Loan_Applications
FROM [BankLoanDB]..bank_loan_data
WHERE MONTH(issue_date) = 12 AND YEAR(issue_date) = 2021;SELECT
(COUNT(CASE WHEN loan_status IN ('Fully Paid', 'Current') THEN id END) * 100.0) / COUNT(id) AS Good_Loan_Percentage,
COUNT(CASE WHEN loan_status = 'Charged Off' THEN id END) AS Bad_Loan_Applications
FROM [BankLoanDB]..bank_loan_data;SELECT
ROUND(AVG(int_rate), 4) * 100 AS Avg_Interest_Rate,
ROUND(AVG(dti), 4) * 100 AS Avg_DTI
FROM [BankLoanDB]..bank_loan_data;Each of these queries was rigorously cross-validated with Tableau visualizations to ensure an accuracy margin within ±0.01%.
All visualizations were built exclusively in Tableau to deliver a highly interactive dashboard experience:
// Parameter-driven measure for dynamic KPI display in Tableau
CASE [Select Measure]
  WHEN "Total Applications" THEN COUNT([id])
  WHEN "Funded Amount" THEN SUM([loan_amount])
  WHEN "Total Received" THEN SUM([total_payment])
  ELSE SUM([loan_amount])
END
Advanced interactive features such as filter actions and drill-downs empower stakeholders to examine data by loan grade, term, and employment length.
For full technical documentation and implementation details, all SQL scripts and Tableau workbooks are hosted on GitHub:
View RepositoryFinancial_Loan_Data.csv and refined using comprehensive SQL cleaning protocols.