Enterprise Multi-Echelon Supply Chain Intelligence, Data Quality Audit, & Strategic Decision Suite
Click any tab or swipe to inspect the 7 dashboard modules • Click canvas to watch walkthrough video
Britannia Trade & Distribution Ltd is a premier British B2B wholesale distributor headquartered in the UK. Operating strictly as a non-manufacturer intermediary, the company sources finished goods across 14 diverse product categories from 60 approved domestic and international suppliers, buffers perpetual stock across 4 regional distribution hubs, and supplies over 4,000 business accounts.
The primary objective of this project was to architect a unified, end-to-end Power BI Business Intelligence suite that transforms fragmented transactional and logistics data into actionable executive insights. The project addresses 25 core stakeholder questions spanning commercial growth, procurement risk, warehouse balance, order fulfillment quality, and margin preservation, while resolving critical underlying dataset anomalies.
Prior to visual reporting, the raw data underwent an exhaustive 4-phase, 39-issue quality audit. Critical design flaws were diagnosed and re-engineered: synthetic flat tables with simultaneous sales and purchases were separated into dual independent facts; collapsed pricing distributions (where televisions cost identical to rice) were rebuilt with realistic market unit economics; over 11,000 backorders falsely stamped as "On-Time" were corrected; and over 7,600 emergency replenishment purchase orders were injected to eliminate warehouse stockout contradictions.
In Power BI, a high-performance star schema was implemented with disconnected dual facts joined through 5 conforming dimension tables. Critical DAX formulas—most notably a reconstructed [Total COGS] measure iterating through product dimension grains to prevent a silent 78% cost undercounting defect—were developed alongside custom TopoJSON UK regional shape maps and multi-level drillthrough architectures.
Britannia Trade & Distribution Ltd operates in the critical middle echelon of the British supply chain. As a non-manufacturing stockist and wholesale distributor, Britannia creates economic value by:
Britannia routes customer purchases through 4 strategic distribution centres across England:
| Distribution Centre | Warehouse Region | Primary Geography Served | Operational Role & Routing Logic |
|---|---|---|---|
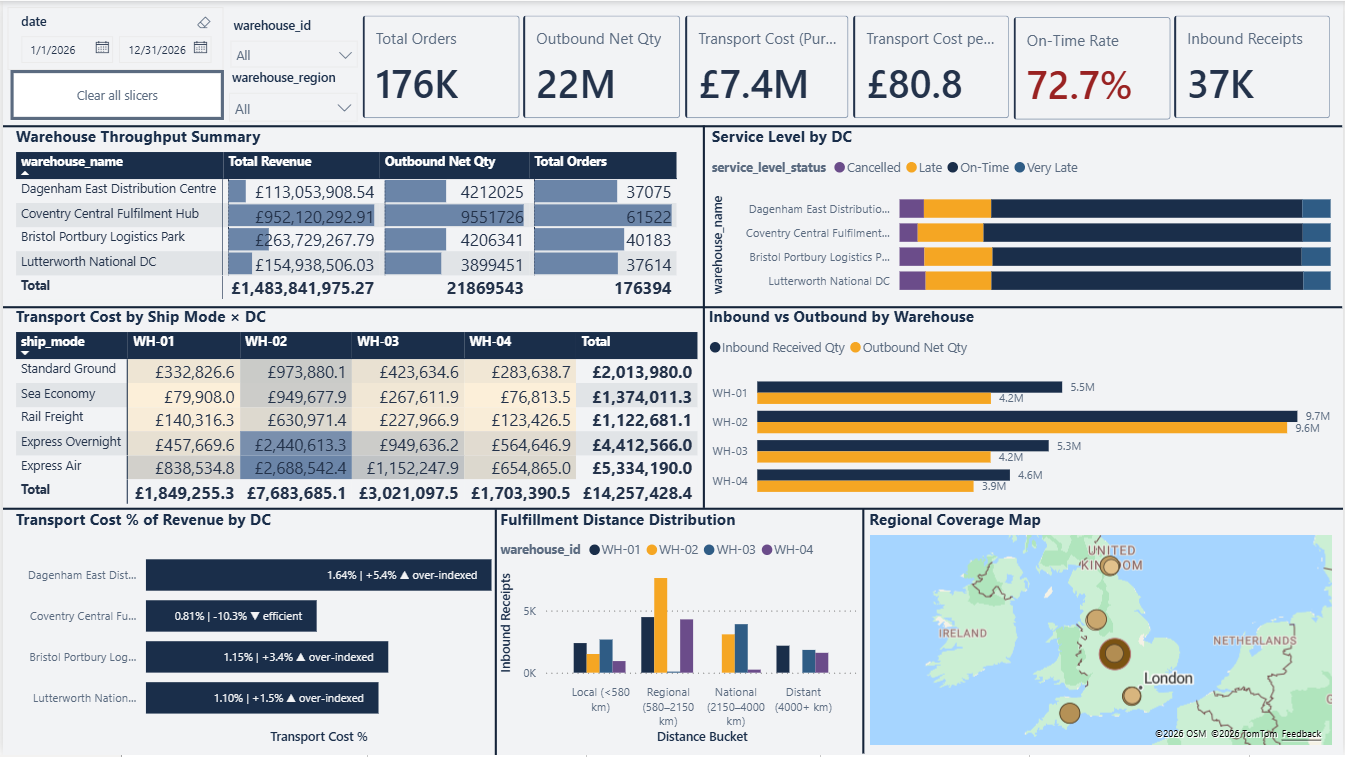
| Coventry Central Fulfilment Hub | Midlands | Midlands, Yorkshire, Northwest England | The network workhorse: handles 64.3% of company volume (£952M). Also fulfills overflow for the unserviced Southwest region. |
| Bristol Portbury Logistics Park | West | Wales, Somerset, Devon, Cornwall | Western hub: processes £263.7M. Manages western international maritime export shipments. |
| Lutterworth National DC | Southeast | Home Counties, South England corridor | Specialist high-velocity facility adjacent to the M1/M6 Golden Triangle. Ships £154.9M. |
| Dagenham East Distribution Centre | Northeast | London, Essex, East Anglia, Southeast corridor | Metropolitan & export gateway hub handling £113M, near deep-sea shipping channels. |
Every account is categorized into one of four immutable customer segments, governing commercial credit eligibility, ordering frequency, and basket sizes:
Britannia’s catalog encompasses 340 distinct commercial SKUs grouped into 14 categories with distinct seasonal demand cycles:
Automotive · Baby · Books · Clothing · Electronics · Grocery · Health · Home · Industrial · Movies · Office · Sports · Tools · Toys
Key seasonal trends include: Electronics & Toys peaking heavily during Q4 holiday trade (November–December); Tools & Industrial accelerating in March–May during commercial infrastructure ramp-ups; and Sports & Health spiking in January around fitness procurement cycles.
Prior to dashboard development, the underlying sales and procurement data underwent a rigorous 4-phase audit. Rather than accepting raw synthetic outputs, 39 systemic defects were cataloged, diagnosed, and resolved to ensure enterprise-grade analytical validity.
Originally, sales and purchases existed in a single flat file sharing identical transaction dates. Goods were recorded as "sold" before or on the exact day they were received from suppliers. The dataset was split into independent sales.csv (178,272 rows) and purchases.csv (37,707 rows), joined strictly via conforming product and warehouse dimensions with verified lag constraints.
In audit Pass 3, unit prices across all 14 categories were discovered to have collapsed into an unrealistic £66–£71 band (e.g. televisions costing £34 identical to bulk bags of rice). The pricing engine was completely reconstructed from ground truth reference points, establishing authentic price tiers from £8 (Grocery/Office) to £850+ (Electronics/Industrial machinery).
Tracking cumulative inventory per product-DC pair revealed that 91.4% of SKUs dipped into negative perpetual stock balances due to unhedged outbound surges. A dynamic safety-stock replenishment algorithm was built, generating 7,636 top-up purchase orders to eliminate stockout violations across all 4 hubs.
The initial Power BI [Total COGS] DAX formula utilized a cross-fact SUMX with context transition that silently dropped 78% of inventory cost, creating wildly inflated margin reports. The measure was re-engineered to iterate over the product dimension (VALUES(dim_products[product_id])), achieving exact penny reconciliation against company totals.
| Unified ID | Issue Name & Description | Severity | Tables Affected | Root Cause & Remediation | Status |
|---|---|---|---|---|---|
| D1 | Sales & Purchases on same row / same date | Critical | Sales & Purchases | Denormalized shortcut. Split into dual fact tables; enforced sale date ≥ delivery date. | Fixed |
| D2 | Single-month data limitation (Jan only) | Critical | Sales & Purchases | Synthetic scope limitation. Expanded generation to full 12 calendar months with seasonal multipliers. | Fixed |
| D3 | Zero price / cost variance across catalog | Critical | Sales & Purchases | Static default values. Applied Gaussian distributions around industry standard category price seeds. | Fixed |
| D4 | Single warehouse & region topology | High | Sales & Purchases | Monolithic model. Expanded to 4 regional DCs and 6 customer trade regions. | Fixed |
| R1-01 | Selling price below landed cost in 42.6% of rows | Critical | Sales & Purchases | Unbounded discounting. Enforced minimum gross margin floors by category (min 15% on non-clearance). | Fixed |
| R1-02 | Uniform delivery lead times across ship modes | Critical | Sales & Purchases | Shared duration generator. Calibrated realistic durations (Overnight: 1-2d, Sea: 35-45d). | Fixed |
| R1-05 | Uniform category purchasing (no B2B affinity) | Critical | Sales | Pure random SKU selection. Assigned commercial category clusters (e.g. pharmacies buy Health/Baby). | Fixed |
| R2-B | 11,041 backorders flagged as Early/On-Time | Critical | Sales | Decoupled status logic. Enforced rule: any backordered shipment is automatically classified as "Late". | Fixed |
| R2-D | 91.4% negative perpetual stock balances | Critical | Both | Unsynchronized sales vs. PO pacing. Injected 7,636 automated safety-stock replenishment POs. | Fixed |
| R3-I | Non-UK geography label ("Midwest") in schema | High | Both | US terminology carry-over. Standardized to "Midlands" aligned with UK administrative zones. | Fixed |
| R3-VI | Category price collapse (£66–71 across all 14) | Critical | Both | Formulaic normalization bug. Re-seeded catalog with authentic category price anchors. | Fixed |
| R4-01 | Warehouse name / region ID mismatch | Critical | Both | Key mapping transposition. Reconciled dimensional warehouse surrogate keys to geographic locations. | Fixed |
| R4-02 | Partial shipment flag inverted in 39.5% of POs | Critical | Purchases | Boolean evaluation threshold error. Verified received_qty < ordered_qty logic. | Fixed |
The Power BI solution is structured around an enterprise star-schema consisting of two independent fact tables joined exclusively through shared, conforming dimensional hierarchies:
dim_customers (4,000 accounts), dim_products (340 SKUs across 14 categories), dim_warehouses (4 regional hubs), dim_suppliers (60 panel vendors), dim_date (continuous date dimension), and MapPoints (geocoded coordinates for Azure Map layers).
Sales orders and purchase orders share no direct foreign key. Cross-fact calculations (such as matching inventory purchase costs against sales revenues to derive gross profit margins) must be resolved at the shared dim_products grain via context transition in DAX.
Total Revenue = SUM(fact_sales_orders[sales_revenue])
Total Purchase Cost =
SUMX(
fact_purchase_orders,
fact_purchase_orders[ordered_quantity] * fact_purchase_orders[purchase_unit_cost]
)
Total COGS =
SUMX(
VALUES(dim_products[product_id]),
CALCULATE(SUM(fact_sales_orders[net_quantity]))
*
CALCULATE(
DIVIDE(
SUMX(fact_purchase_orders, fact_purchase_orders[ordered_quantity] * fact_purchase_orders[purchase_unit_cost]),
SUM(fact_purchase_orders[ordered_quantity])
)
)
)
Gross Margin Proxy = [Total Revenue] - [Total COGS]
Gross Margin % = DIVIDE([Gross Margin Proxy], [Total Revenue], 0)
On-Time Rate =
DIVIDE(
COUNTROWS(FILTER(fact_sales_orders, fact_sales_orders[service_level_status] = "On-Time")),
COUNTROWS(fact_sales_orders)
)
Inbound Fill Rate =
DIVIDE(
SUM(fact_purchase_orders[received_quantity]),
SUM(fact_purchase_orders[ordered_quantity])
)
Supplier Quality Rate =
DIVIDE(
COUNTROWS(FILTER(fact_purchase_orders, fact_purchase_orders[quality_flag] = "Issue")),
COUNTROWS(fact_purchase_orders)
)
Partial Shipment Rate =
DIVIDE(
COUNTROWS(FILTER(fact_purchase_orders, fact_purchase_orders[partial_shipment_flag] = TRUE())),
COUNTROWS(fact_purchase_orders)
)
Waterfall MoM Revenue Display =
VAR CurrentRevenue = [Total Revenue]
VAR MinSelectedDate = CALCULATE(MIN(dim_date[date]), ALLSELECTED(dim_date))
VAR CurrentMonthStart = MIN(dim_date[date])
VAR IsFirstMonth = CurrentMonthStart = MinSelectedDate
VAR PreviousRevenue =
CALCULATE([Total Revenue], DATEADD(dim_date[date], -1, MONTH))
RETURN
IF(
IsFirstMonth,
CurrentRevenue,
IF(ISBLANK(PreviousRevenue) || ISBLANK(CurrentRevenue), BLANK(), CurrentRevenue - PreviousRevenue)
)
On-Time Rate (Map Tooltip) =
VAR CurrentPointType = SELECTEDVALUE(MapPoints[PointType])
RETURN
SWITCH(
TRUE(),
CurrentPointType = "Customer Region",
CALCULATE(
[On-Time Rate],
TREATAS(VALUES(MapPoints[PointName]), dim_customers[customer_region])
),
CurrentPointType = "Distribution Centre",
CALCULATE(
[On-Time Rate],
TREATAS(VALUES(MapPoints[PointName]), dim_warehouses[warehouse_name])
)
)
The Power BI suite features a standardized 1280×720 widescreen canvas with a 180px persistent left navigation rail. It delivers targeted, persona-driven analytics across seven specialized report pages:
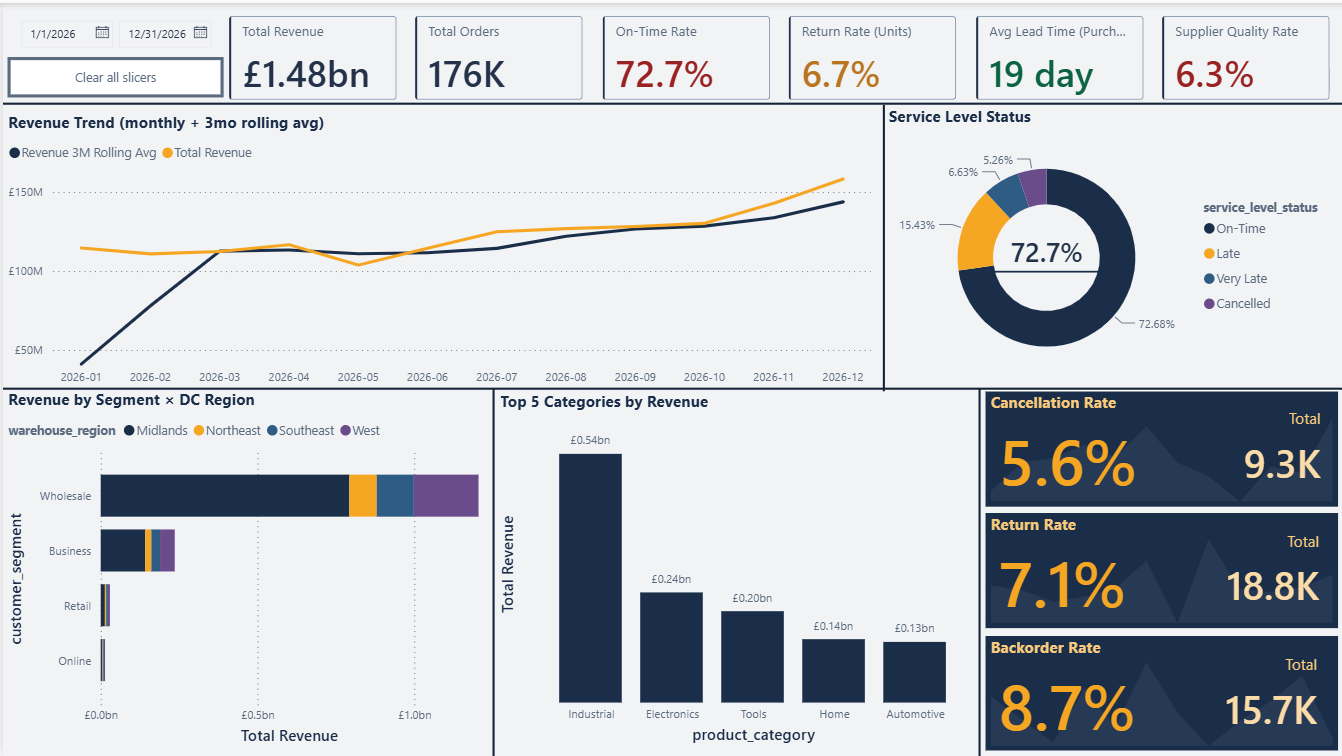
Audience: Chief Executive Officer, Managing Director, Operating Board.
Design Philosophy: A 5-second operational health scan. Top row cards provide the binary verdict, middle visuals reveal segment/channel distribution, and the right-hand Issue Trend Trio tracks emerging operational risks.
Total Revenue: £1,483.84MTotal Orders: 178,272 ordersOn-Time Rate: 72.7% RED (<85%)Return Rate (Units): 6.7% AMBER (5-10%)Avg Lead Time: 15.5 days GREEN (<20d)Supplier Quality Rate: 6.3% RED (>5%)
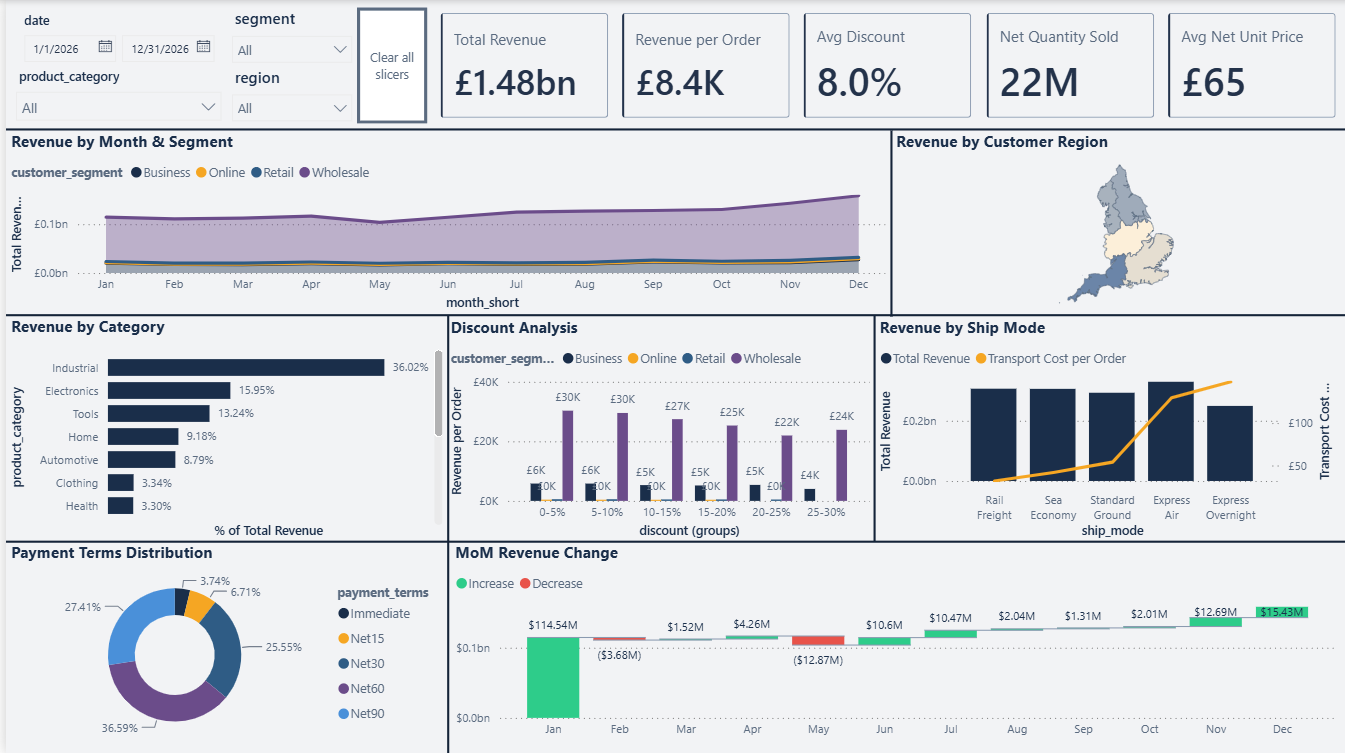
Audience: Commercial Director, Sales Managers, Corporate Finance.
Core Inquiries: Where is revenue originating, and what discount margin concessions are being surrendered?
britannia_5regions_final.topojson): Saturated choropleth of UK regions (Midlands, Northeast, Northwest/West, Southeast, Southwest) with International revenue filtered for separate handling.
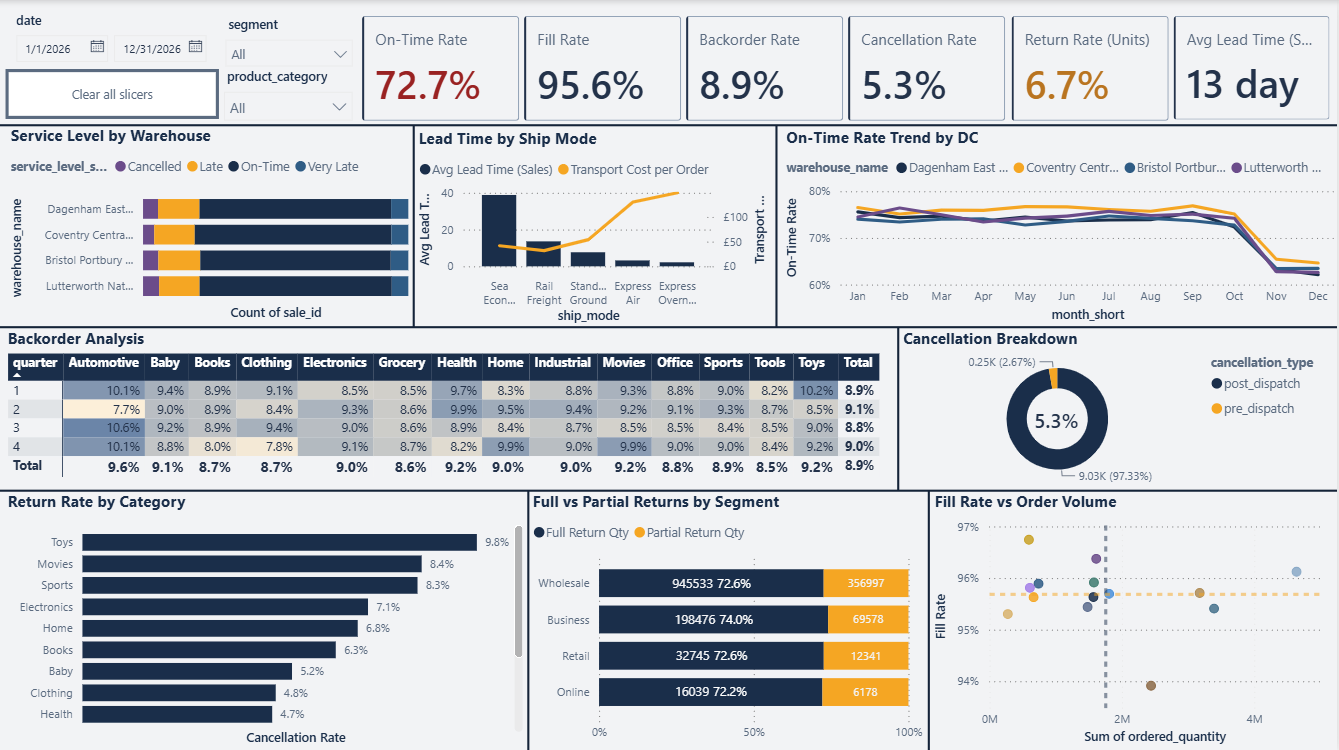
Audience: Operations Director, Distribution Centre Managers, Quality Assurance.
Focus: Service level agreements, delivery lead times, backorders, and return rates.
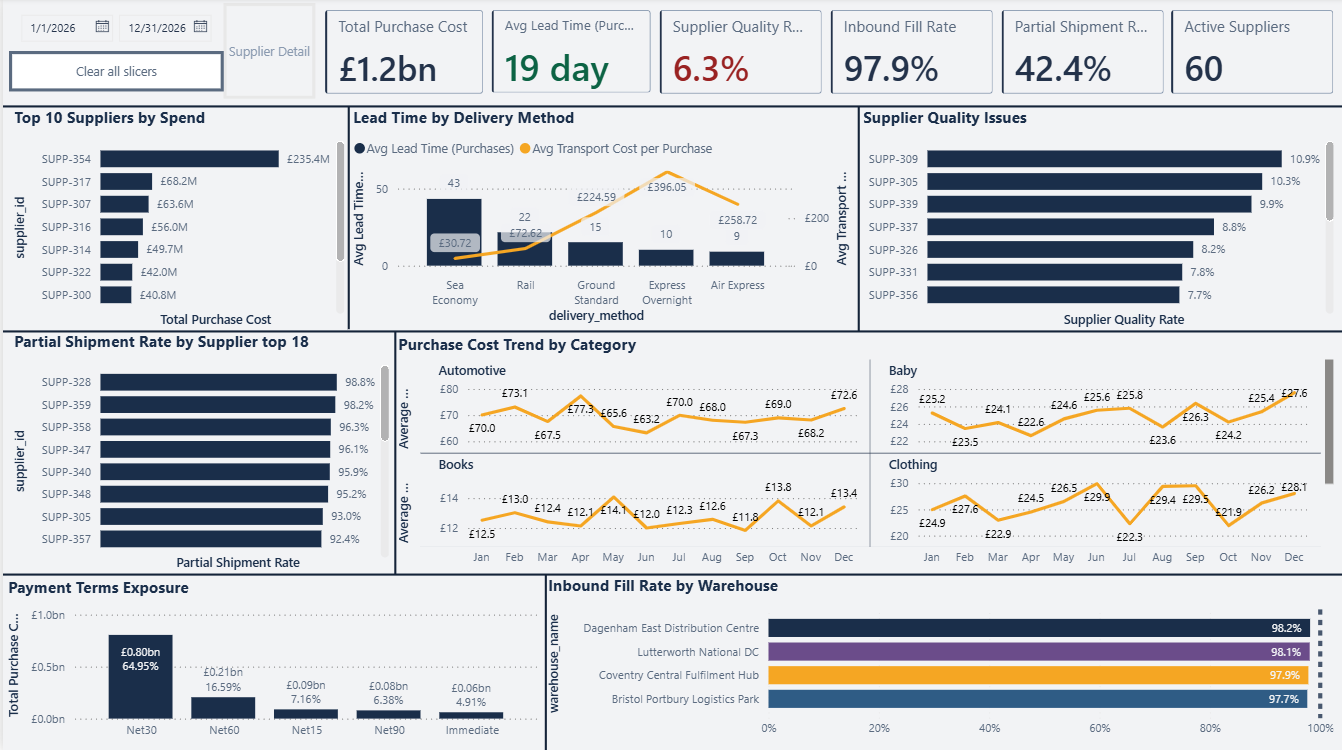
Audience: Procurement Director, Strategic Sourcing, Inbound Logistics.
Core Inquiries: Vendor reliability, lead-time predictability, supplier quality, and spend concentration.
Audience: Head of Logistics, Transport Managers, Facility Supervisors.
Focus: Throughput balance, material flow equilibrium, freight cost ratios, and geographic reach.
Audience: Commercial Category Managers, Merchandising, Pricing Teams.
Focus: Product profitability, catalog rationalization, margin proxy evaluation, and quality risk.
Audience: Commercial Director, Key Account Directors, Sales Operations.
Focus: Account revenue concentration, service level equity, and segment health.
Beyond the 7 primary canvases, the architecture includes dedicated contextual inspection layers:
TREATAS DAX measures over Page 5 Azure Map points.The dashboard suite was validated against 25 specific operational and financial questions posed by Britannia’s senior leadership team. Key evidence and strategic verdicts are documented below:
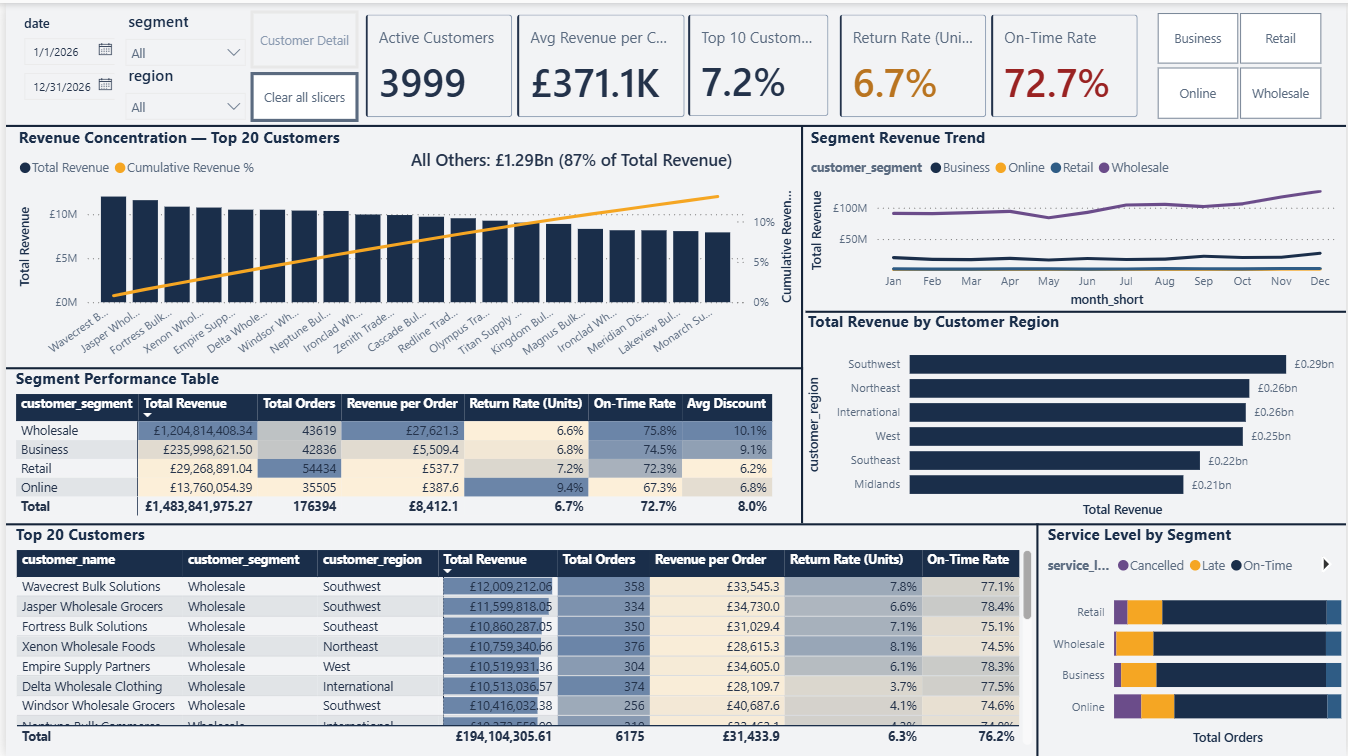
Comparing January to December revenue reveals balanced expansion across all three core business channels: Wholesale grew +38.6% (£90.9M to £126.0M), Business grew +36.0% (£20.0M to £27.2M), and Retail rose +25.0% (£2.4M to £3.0M). Online expanded by +98.3% (£847K to £1.68M), representing an emerging high-growth segment.
The top 20 customers (representing just 0.5% of the 3,999-account base) account for exactly 13.0% of gross turnover (£193M of £1.48Bn). The remaining 3,979 clients generate 87.0% of revenue.
Analyzing revenue per order across discount tiers confirms the 5–10% discount band generates the highest aggregate revenue across Wholesale (£361.0M), Business (£73.9M), and Online (£5.3M). Deeper discounts (20–30%) fail to generate higher basket values and result in severe margin erosion.
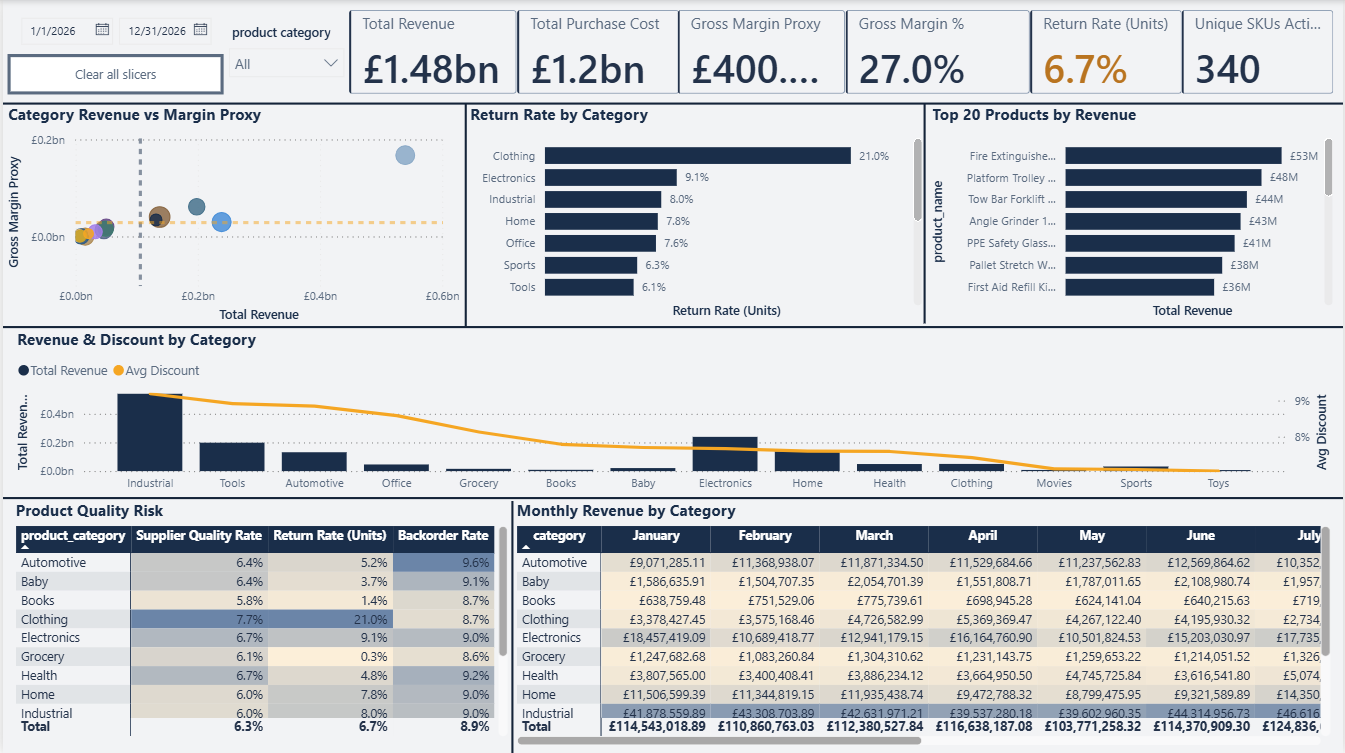
Crucially, Grocery is discounted at an average of 8.1% while producing a −2.5% gross margin. Every discounted grocery order accelerates cash losses. Books (7.8% discount, 1.4% margin) operates dangerously close to break-even.
Regional sales totals: Southwest (£286.57M), Northeast (£258.55M), International (£255.83M), West (£253.58M), Southeast (£220.94M), and Midlands (£208.36M).
Of 60 approved suppliers, 27 operate above the 42.4% company average. 8 suppliers exceed a 90% partial shipment rate, and an additional 5 sit between 80–90%.
The top 10 suppliers capture 53.1% of total procurement expenditure (£658.1M of £1,239.2M). Supplier 354 alone commands 19.0% (£235M) of all purchases.
Inbound delivery metrics:
Full-year on-time delivery rates are uniform across all 4 hubs: Coventry Central (72.8%), Bristol Portbury (72.4%), Lutterworth National (73.1%), and Dagenham East (72.1%). However, during November and December, on-time rates plunged across all DCs from 74% down to 63%.
Clothing (21.0% return rate): Traces directly to inbound supplier quality, where Clothing tops the catalog with a 7.7% defect rate. Despite this, Clothing yields Britannia’s highest gross margin rate (39.8%).
Toys (9.8% cancellation rate): Driven by stockouts during severe Q4 holiday demand spikes (£399K/mo rising to £1,695K in December), compounded by zero inventory allocation from Coventry Central.
Comparing annual received units against net outbound shipments:
Following the DAX [Total COGS] correction, full-year gross margin reconciliation reveals:
Three immediate levers were identified:
Enforcing strict inbound Supplier SLAs and QA Gateways targets the 42.4% Partial Shipment Rate and 6.3% Supplier Defect Rate.
Based on the 25 stakeholder findings, a phased implementation plan is outlined for executive execution:
| Table Name | Type | Row Count | Primary Key | Business Description |
|---|---|---|---|---|
fact_sales_orders |
Fact Table | 178,272 | sale_id |
Transactional order lines fulfilling B2B customer purchases. |
fact_purchase_orders |
Fact Table | 37,707 | purchase_id |
Inbound supplier purchase orders and warehouse receipts. |
dim_customers |
Dimension | 4,000 | customer_id |
Customer master: business accounts, commercial segment, geographic territory. |
dim_products |
Dimension | 340 | product_id |
Product catalog: category, subcategory, base unit cost, standard trade price. |
dim_warehouses |
Dimension | 4 | warehouse_id |
Regional distribution centres: hub name, region, square footage, throughput capacity. |
dim_suppliers |
Dimension | 60 | supplier_id |
Approved vendor panel: category specialisms, payment terms, geographical origin. |
dim_date |
Dimension | 365 | date |
Standard fiscal calendar table supporting Time Intelligence DAX expressions. |
MapPoints |
Dimension / GIS | 10 | PointName |
Geocoded latitude/longitude coordinates powering the Azure Map visualization. |
On-Time, Late, Very Late, Cancelled) evaluating delivery completion against ship mode SLA windows.
shipped_quantity - return_quantity.
Clean vs. Issue).
This enterprise project demonstrates multidisciplinary competencies across business intelligence, data engineering, supply chain modeling, and cartography:
Access the complete suite of open-source deliverables, including the compiled Power BI workbook, enterprise SQL database schema, custom visual theme, TopoJSON cartographic shape files, and detailed audit logs:
Full 7-page interactive .pbix file with DAX measures, drillthroughs, and custom tooltips.
Complete SQL DDL and relational schema script for sales, purchase orders, and dimensions.
Get SQL Database (.sql)Custom corporate theme configuration (.json) standardizing typography, colors, and RAG rules.
Custom TopoJSON cartographic boundary file engineered for Britannia's 5 UK customer sales regions.
Get TopoJSON (.topojson)Consolidated 800+ line technical audit log detailing all 39 synthetic and structural defect fixes.
View Audit Log on GitHub (.md)Full executive analytical dossier answering all 25 stakeholder inquiries with verified data citations.
View Insights on GitHub (.md)Complete open-source repository containing all datasets, DAX scripts, TopoJSON files, and documentation:
View Britannia-B2B-Supply-Chain-Analytics on GitHub